Compare versions
Version 1 → Version 2 (current). Removed · Added. This shows the entry's text as it is written, including its formatting marks.
Version 1 · Version 2 (current) · Version history
Side by side · Together
Nonfarm payrolls is the monthly count of paid jobs at U.S. businesses,employers governmentand agenciescivilian andgovernment nonprofits,agencies, excluding farm work, published monthlyeach month by the Bureau of Labor Statistics as a measure of U.S. job growth.
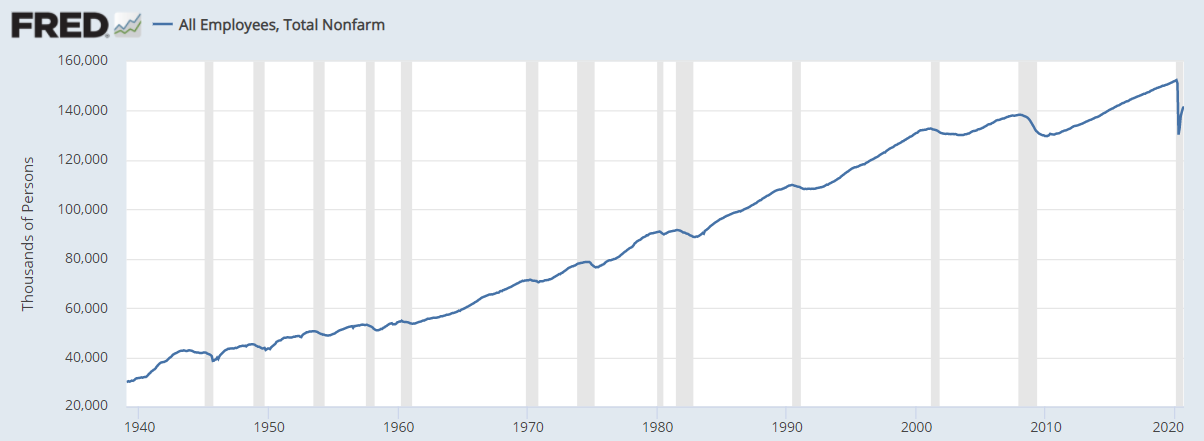
*Via Wikimedia Commons: [Nonfarm payrolls](https://commons.wikimedia.org/wiki/File:Nonfarm_payrolls.png) by FRED, public domain.*
The figure comes from the Current Employment Statistics (CES) survey, a monthly survey of employers run by the Bureau of Labor Statistics (BLS), and is released in the BLS's *Employment Situation* report, often simply called "the jobs report".report. The headline number is the change in total nonfarm employment from the previous month. In the report released on 6 November 2026, for example, the BLS stated that [total nonfarm payroll employment rose by 165,000 in October 2026](https://www.bls.gov/news.release/empsit.nr0.htm). The level itself is far larger: the Federal Reserve Bank of St. Louis's FRED database, which republishes the BLS series, lists [159,293 thousand jobs, seasonally adjusted, for October 2026](https://fred.stlouisfed.org/series/PAYEMS).
## What is counted
The BLS defines CES employment as [the number of persons on establishment payrolls who received pay for any part of the pay period that includes the 12th day of the month](https://www.bls.gov/opub/hom/ces/concepts.htm). An "establishment" is a single place of business, such as a factory, store or office. The count is of jobs, not people: [persons working at multiple worksites are counted as employed at each worksite](https://www.bls.gov/opub/hom/ces/concepts.htm).
Several groups are left out by design. The data [exclude sole proprietors, the unincorporated self-employed, unpaid volunteer or family workers, farm workers, and domestic workers](https://www.bls.gov/opub/hom/ces/concepts.htm), and government employment [covers only civilian employees; military personnel are excluded](https://www.bls.gov/opub/hom/ces/concepts.htm). The farm exclusion gives the series its name. Someone who works part of the reference pay period counts as employed even if on strike for the rest of it, but people [on layoff, on leave without pay, or on strike for the entire period](https://www.bls.gov/opub/hom/ces/concepts.htm) do not.
The survey also produces figures for average hourly earnings, average weekly hours and real earnings, broken down by industry under the North American Industry Classification System (NAICS), the standard way of grouping businesses by what they do. The BLS describes the program as producing [detailed industry estimates of nonfarm employment, hours, and earnings of workers on payrolls](https://www.bls.gov/opub/hom/ces/home.htm).
## How it is measured
According to the technical note to the October 2026 report, the CES program surveys [about 119,000 businesses and government agencies each month, covering approximately 622,000 individual worksites](https://www.bls.gov/news.release/empsit.tn.htm), and its active sample includes [approximately 26 percent of all nonfarm payroll jobs](https://www.bls.gov/news.release/empsit.tn.htm). The sample is [selected from the unemployment insurance (UI) file](https://www.bls.gov/opub/hom/ces/data.htm), the list of employers in the state unemployment insurance system. Employers are first enrolled by telephone interview and then usually report through web forms, or, for large firms and government agencies with many locations, by [electronic data interchange (EDI)](https://www.bls.gov/opub/hom/ces/data.htm).
Because it is a sample, the monthly figure carries sampling error. The BLS puts the 90 percent confidence interval for the monthly change in total nonfarm employment at [on the order of plus or minus 122,000](https://www.bls.gov/news.release/empsit.tn.htm). A reported gain smaller than that cannot be statistically distinguished from no change.
### New and closing businesses
A sample drawn from existing employers cannot see businesses that have just opened, and businesses that close often simply stop responding. The BLS handles this with what it calls the birth-death model. It notes [an unavoidable lag between an establishment opening for business](https://www.bls.gov/web/empsit/cesbd.htm) and its appearing in the sampling frame. The model has two parts: firms that go out of business are not dropped but are given [the same trend as the other firms in the sample](https://www.bls.gov/web/empsit/cesbd.htm), and a statistical forecasting model (an ARIMA model) [estimates the residual birth-death employment not accounted for by the imputation](https://www.bls.gov/web/empsit/cesbd.htm), using records of actual business openings and closings over the past five years. Starting with the January 2026 estimates, the BLS modified the forecast to incorporate [current sample information](https://www.bls.gov/web/empsit/cesbd.htm).
The approach has long been criticised as weakest when the economy changes direction. A 2008 Economic Letter from the Federal Reserve Bank of San Francisco observed that because it assumes historical patterns continue, the model [produces unreliable estimates at economic turning points](https://www.frbsf.org/wp-content/uploads/el2008-09.pdf).
## Revisions
The first figure for any month is preliminary. The BLS revises each monthly estimate [for 2 months after initial release](https://www.bls.gov/opub/hom/ces/home.htm) as more employers report. In the October 2026 report, for example, August's gain was [revised up by 53,000, from +133,000 to +186,000](https://www.bls.gov/news.release/empsit.nr0.htm), and September's [by 31,000, from +29,000 to +60,000](https://www.bls.gov/news.release/empsit.nr0.htm).
Once a year comes a larger correction, the benchmark revision. The survey's estimate for March is compared with a near-complete count of jobs drawn from the unemployment insurance tax records that almost every employer files, which the BLS tabulates in its Quarterly Census of Employment and Wages (QCEW). About [97 percent of total nonfarm employment is covered by UI](https://www.bls.gov/web/empsit/cesbmart.htm); the rest is estimated from other sources, such as Railroad Retirement Board records. The BLS treats the difference between the survey's March figure and the full count as [a rough proxy for total survey error](https://www.bls.gov/news.release/empsit.tn.htm), and as of November 2026 states that [the absolute average benchmark revision for total nonfarm employment over the prior 10 years is 0.2 percent](https://www.bls.gov/news.release/empsit.tn.htm).
Recent benchmarks have been larger than that average. The benchmark for March 2025, published with the January 2026 data on 11 February 2026, revised seasonally adjusted total nonfarm employment by [−898,000, or −0.6 percent](https://www.bls.gov/web/empsit/cesbmart.htm). According to the BLS, actual net business births and deaths from April 2024 to March 2025 were [approximately 117,000 below the forecast](https://www.bls.gov/web/empsit/cesbmart.htm). The not-seasonally-adjusted revisions it lists for 2015 to 2024 range from [−0.4 percent in 2024 to +0.3 percent in 2022](https://www.bls.gov/web/empsit/cesbmart.htm). The preliminary estimate for March 2026, released on 28 August 2026, was a revision of [−79,000 (−0.1 percent)](https://www.bls.gov/news.release/prebmk.nr0.htm), with the final figure due in [the January 2027 Employment Situation news release in February 2027](https://www.bls.gov/news.release/prebmk.nr0.htm).
Because the QCEW counts arrive months before the BLS benchmarks to them, others use them to anticipate revisions. The Federal Reserve Bank of Philadelphia publishes quarterly [early benchmark estimates of monthly state employment](https://www.philadelphiafed.org/surveys-and-data/regional-economic-analysis/early-benchmark-revisions) that combine QCEW data with the CES sample, while cautioning that the sum of its state estimates [is not designed nor intended to be an accurate measure of national employment](https://www.philadelphiafed.org/surveys-and-data/regional-economic-analysis/early-benchmark-revisions).
## Payrolls and the household survey
The same *Employment Situation* report contains a second, independent measure of employment from the Current Population Survey, a monthly survey of [about 60,000 eligible households](https://www.bls.gov/news.release/empsit.tn.htm), which also yields the unemployment rate. The two differ in what they count. The BLS lists the main differences: the household survey [includes agricultural, self-employed (unincorporated), unpaid family, and private household workers](https://www.bls.gov/news.release/empsit.tn.htm), counts people on unpaid leave as employed, covers only people aged 16 and over, and counts each person once however many jobs they hold, whereas the payroll survey counts each job.
The two series usually move together but sometimes diverge. In 2007 the household series slowed much more sharply than the payroll series, and the San Francisco Fed's analysis found that [only one-fourth of the growth discrepancy (through December 2007) can be attributed to definitional differences](https://www.frbsf.org/wp-content/uploads/el2008-09.pdf), with the yearly benchmark revision to the payroll series accounting for slightly less. It noted that over the long run the two [typically track each other closely](https://www.frbsf.org/wp-content/uploads/el2008-09.pdf), with payroll employment tending to grow faster than household employment during expansions. The household survey's monthly estimates are [most reliable for key ratios, such as the rates of unemployment and labor force participation](https://www.frbsf.org/wp-content/uploads/el2008-09.pdf); its employment estimates, the same letter notes, are subject to [a large sampling error, which produces high monthly variability](https://www.frbsf.org/wp-content/uploads/el2008-09.pdf).
## History
The survey is more than a century old. The BLS began collecting employment and payroll data in October 1915 from [four manufacturing industries: boots and shoes, cotton goods, cotton finishing, and hosiery and underwear](https://www.bls.gov/opub/hom/ces/history.htm). In 1916 it signed its first cooperative agreement with a state, New York, and covered [13 industries with 574 establishments and 519,185 jobs](https://www.bls.gov/opub/hom/ces/history.htm). Nonmanufacturing industries were added in the late 1920s, and by 1932 the sample had reached [70,000 establishments covering 4.5 million jobs](https://www.bls.gov/opub/hom/ces/history.htm).
The unemployment insurance system created by the Social Security Act of 1935 later gave the survey its benchmark. The BLS published its first UI-based benchmark in 1940, completed continuous series [back to 1919](https://www.bls.gov/opub/hom/ces/history.htm) for total nonfarm employment in 1950, and began publishing seasonally adjusted estimates in 1954. After criticism of the sample design by the Levitan Commission in 1979, it began [benchmarking every year](https://www.bls.gov/opub/hom/ces/history.htm) in 1982.
A redesign announced in 1995 replaced a sample design that was not a probability sample with one that was, in which every business has a known chance of selection. It was [fully implemented in 2003](https://www.bls.gov/opub/hom/ces/history.htm), together with the birth-death model, a move from the older Standard Industrial Classification to NAICS, and concurrent seasonal adjustment. Later changes included collecting payroll and hours data for all employees from 2006, quarterly rather than annual sample rotation from 2014, and [temporary adjustments for the COVID-19 pandemic](https://www.bls.gov/opub/hom/ces/history.htm) from March 2020 to October 2021.
## Sources
- U.S. Bureau of Labor Statistics, "The Employment Situation — October 2026", news release, 6 November 2026. https://www.bls.gov/news.release/empsit.nr0.htm
- U.S. Bureau of Labor Statistics, "Technical Note", *The Employment Situation — October 2026* (last modified 6 November 2026). https://www.bls.gov/news.release/empsit.tn.htm
- U.S. Bureau of Labor Statistics, *Handbook of Methods*, "Current Employment Statistics – CES (National)": Overview, Concepts, Data Sources and History (last modified 28 February 2025). https://www.bls.gov/opub/hom/ces/home.htm ; https://www.bls.gov/opub/hom/ces/concepts.htm ; https://www.bls.gov/opub/hom/ces/data.htm ; https://www.bls.gov/opub/hom/ces/history.htm
- U.S. Bureau of Labor Statistics, CES national benchmark article for March 2025, published with January 2026 data, 11 February 2026. https://www.bls.gov/web/empsit/cesbmart.htm
- U.S. Bureau of Labor Statistics, "Current Employment Statistics Preliminary Benchmark (National) Summary", 28 August 2026. https://www.bls.gov/news.release/prebmk.nr0.htm
- U.S. Bureau of Labor Statistics, CES birth-death model page (last modified 6 November 2026). https://www.bls.gov/web/empsit/cesbd.htm
- Federal Reserve Bank of St. Louis, FRED, "All Employees, Total Nonfarm (PAYEMS)" (read November 2026). https://fred.stlouisfed.org/series/PAYEMS
- Federal Reserve Bank of Philadelphia, "Early Benchmark Revisions of State Payroll Employment" (last updated 4 September 2026). https://www.philadelphiafed.org/surveys-and-data/regional-economic-analysis/early-benchmark-revisions
- Tali Regev, "Assessing Employment Growth in 2007", *FRBSF Economic Letter* 2008-09, Federal Reserve Bank of San Francisco, 7 March 2008. https://www.frbsf.org/wp-content/uploads/el2008-09.pdf
