Version 5
Nov 17, 2026. Compare with the current version · Version history
An initial public offering (IPO) is the first sale of a company's shares to the general public, usually made to raise new capital, after which the shares normally trade on a stock exchange and the company becomes "public".
The U.S. Securities and Exchange Commission (SEC) describes an IPO as the point at which a company sells shares to the public, usually to raise additional capital.[1] Before the offering a company's shares are held privately, typically by its founders, employees and early investors; afterwards anyone can buy them in the market, and the company takes on the disclosure duties of a publicly traded firm. The phrase "going public" is used for the same step.
Why companies go public
In a 2002 survey of research on the subject in the Journal of Finance, the economists Jay Ritter and Ivo Welch wrote that in most cases the main reason is the desire to raise equity capital for the firm and to create a public market in which founders and other shareholders can later turn some of their holdings into cash.[6] Equity capital is money raised by selling ownership stakes rather than by borrowing. Non-financial motives, such as publicity, play only a minor part for most firms, according to the same review.
Ritter and Welch also summarised several academic theories of the decision. One holds that investors in a young private company, such as "angel" investors and venture capitalists (firms that invest in young companies in exchange for shares), hold undiversified portfolios and so will not pay as much as diversified public investors; set against that are the fixed costs of going public and the difficulty of revealing confidential information, so a firm stays private early in its life and goes public if it grows sufficiently large.[6] Another observes that many IPOs are exits less for the founders than for the venture capitalists who backed them.[6] Market-timing theories hold that firms put off selling shares when they believe the market undervalues them and go public when prices are favourable, which helps explain why the number of IPOs rises and falls so sharply from year to year.
History
Selling shares in an enterprise to outside investors is centuries older than the term "IPO". The Dutch East India Company (Vereenigde Oostindische Compagnie, or VOC), founded in 1602, is a much-studied early example. According to a 2012 study by the economic historians Oscar Gelderblom, Abe de Jong and Joost Jonker, the company had transferable shares and limited liability for shareholders from the outset, raised a capital of 6.4 million guilders from subscribers who paid in four instalments, and was at first meant to be liquidated after ten years, with capital returned to shareholders; it obtained a permanent capital only in 1612.[7] Transferable shares are shares that can be sold to someone else; limited liability means a shareholder can lose no more than the amount invested.
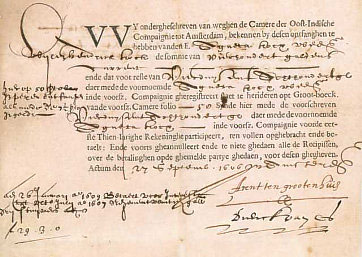
Via Wikimedia Commons: Voc-stock by VOC, public domain.
In the United States, the modern rules for public offerings date from the New Deal. The Securities Act of 1933 has two basic aims, according to the SEC: that investors receive financial and other significant information about securities offered for public sale, and that deceit, misrepresentation and other fraud in the sale of securities are prohibited.[3] The Securities Exchange Act of 1934 created the Securities and Exchange Commission and gave it power to require periodic reporting of information by companies with publicly traded securities.[3]
How an IPO works in the United States
Registration and the prospectus
Under the Securities Act, a company that wants to make a registered public offering must file a registration statement with the SEC, and it may not sell the securities until the SEC staff declares that statement effective.[1] The registration forms call for a description of the company's properties and business, a description of the security being offered, information about management, and financial statements certified by independent accountants.[3] The part of the registration statement given to investors is the prospectus. The SEC requires the information to be accurate but does not guarantee it: the system rests on disclosure, which leaves investors, not the government, to judge whether to buy. Once the registration statement is effective, the company becomes subject to the reporting requirements of the 1934 Act, which require annual and other periodic reports from companies above certain size thresholds (SEC).
Since the Jumpstart Our Business Startups (JOBS) Act, enacted on April 5, 2012, smaller issuers can qualify as "emerging growth companies". As of November 2026, the SEC defines these as companies with total annual gross revenues of less than $1.235 billion in their last fiscal year.[2] They may give scaled-down disclosure, including audited financial statements for two fiscal years rather than three, may "test the waters" by talking with large institutional investors about a possible offering, and can keep the status for up to five fiscal years after the IPO.[2]
Underwriters and bookbuilding
Most IPOs are sold through underwriters, the investment banks that market the offering, set its price with the company and place the shares with investors. The usual method in the United States is "bookbuilding". As Ritter and Welch describe it, a preliminary offer price range is set, and the underwriters and the company then go on a "road show" to present the company to prospective investors, who give "indications of interest": how many shares they would buy and at what price. If demand is strong, the underwriter sets a higher offer price. The bookbuilding period is typically about four weeks long.[6] The underwriters have discretion over which investors receive shares, and how many.
The underwriters are paid a fee called the "gross spread", stated as a percentage of the money raised. For mid-sized American IPOs the spread is strikingly uniform. Of the 1,141 operating-company IPOs in 2001–2025 that raised between $30 million and $160 million (in 2025 dollars), 93.3 percent had a gross spread of exactly 7 percent, according to statistics compiled by Ritter at the University of Florida (updated November 2026); among larger deals, 54.4 percent paid less than 7 percent.[5]
The over-allotment option and price stabilisation
Underwriters control not only who receives shares but how many are sold in total. Ritter and Welch noted that almost all IPOs contain an overallotment option for up to 15 percent of the shares offered, known as a "Green Shoe" option after the first company to include one, in its 1963 IPO.[6] When demand is strong the underwriter allocates 115 percent of the shares; if the price then weakens in aftermarket trading, it can buy back up to the extra 15 percent and retire them as if they had never been offered.[6] Citing a 2000 study by Reena Aggarwal, they added that when weak demand is expected an underwriter typically allocates up to 135 percent of the offering, taking a "naked" short position (a sale of shares it does not hold and cannot simply cancel) that it later covers by buying in the market.[6]
Once trading begins, the lead underwriter may try to "stabilise" the price by reducing selling pressure, through its allocation policy, its own purchases of shares after the offering, and discouraging quick resale. Ritter and Welch described price stabilisation as the only instance in which the SEC permits active attempts to manipulate a stock's price.[6] One tool is the penalty bid, by which the lead underwriter takes back the selling commission from a broker whose clients "flip" (quickly resell) their shares (Ritter and Welch, 2002).[6]
The quiet period and analyst coverage
Banks that underwrite an IPO are barred from publishing research on the company for a short time after it. When Ritter and Welch wrote in 2002 this "quiet period" lasted 25 calendar days, after which the managing underwriters typically began coverage, usually with a "buy" or "strong buy" recommendation; they cited a study finding that IPOs from 1996 to 2000 rose by an average of three percent when their quiet periods ended.[6] As of November 2026, FINRA Rule 2241 requires member firms' policies to bar research reports and public appearances by research analysts about the issuer, if the firm took part in the offering as an underwriter or dealer, for a minimum of 10 days following the date of an initial public offering, and exempts offerings by emerging growth companies from that requirement.
Lock-ups
Shareholders who held shares before the IPO usually agree not to sell them for a set time afterwards without the lead underwriter's permission. Ritter and Welch noted that although there is no legal minimum, most lockup periods are 180 calendar days in length and almost none are shorter than 90 days.[6]
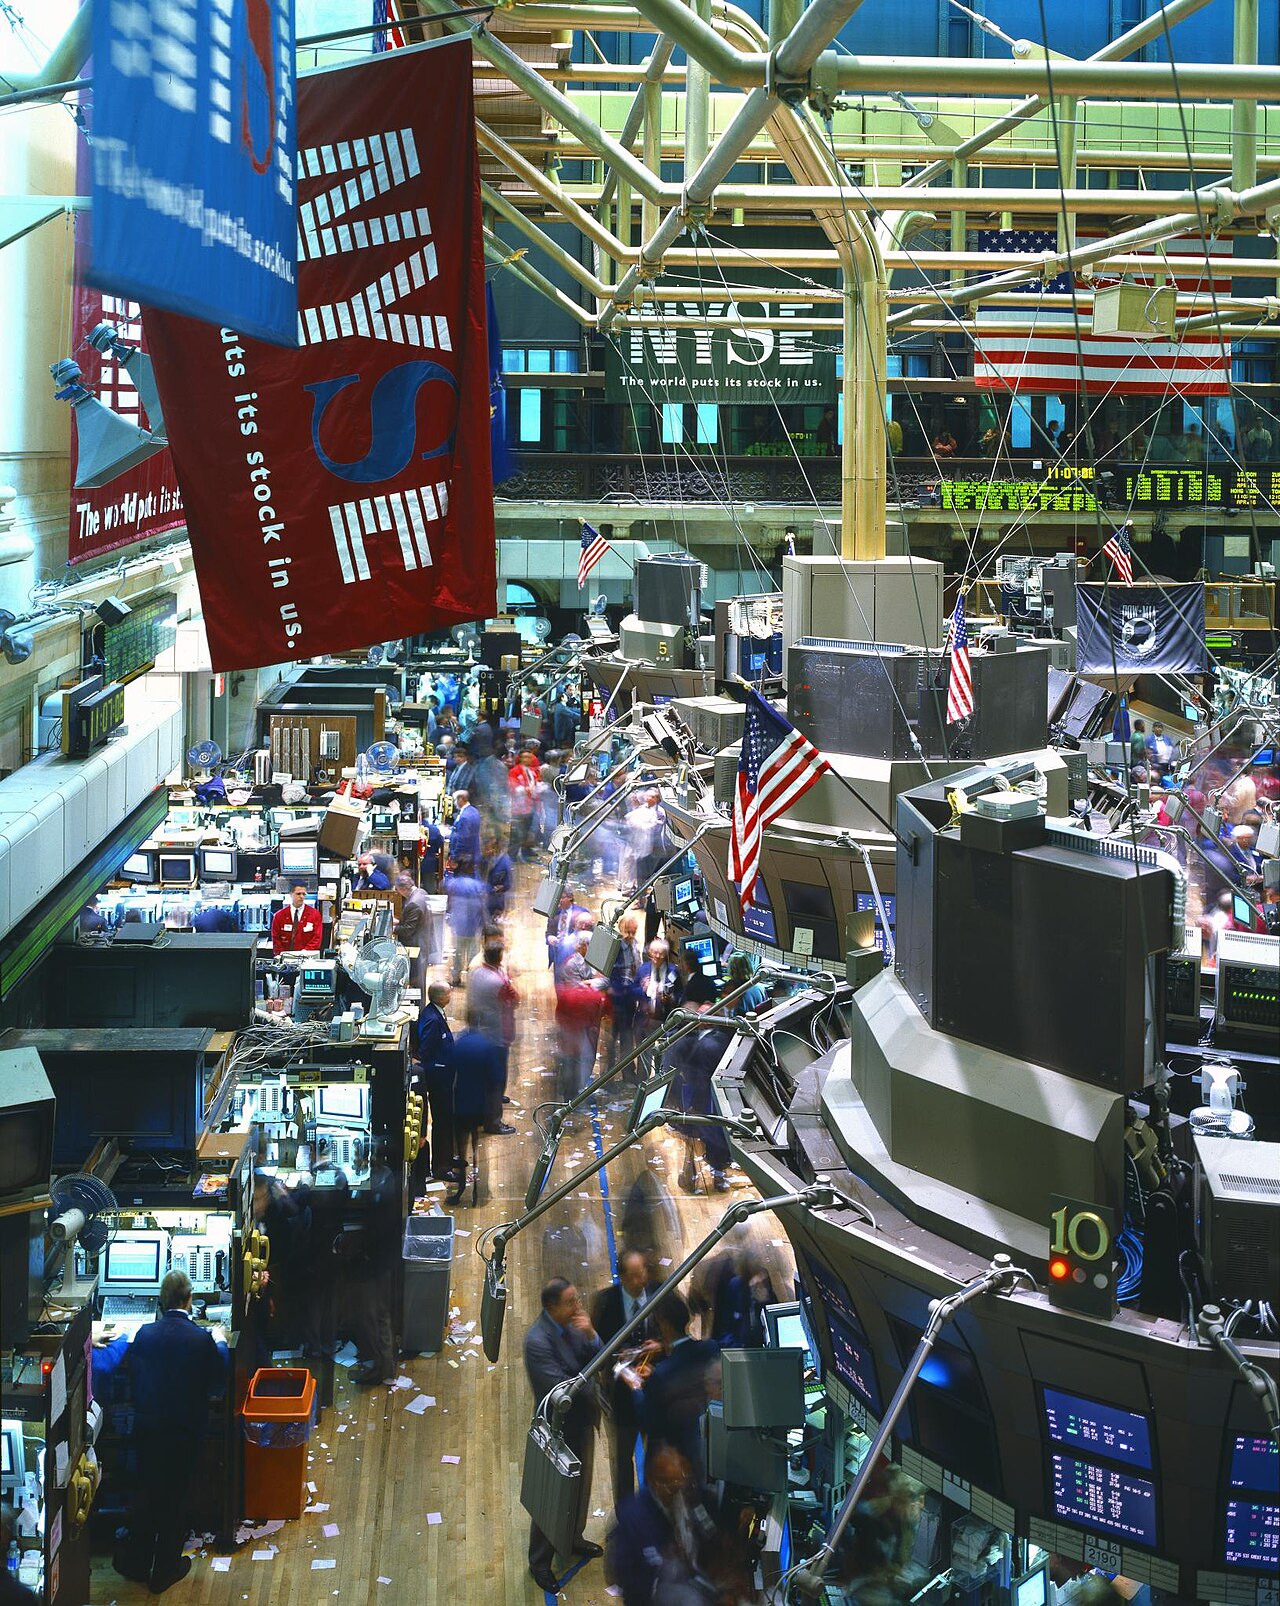
Via Wikimedia Commons: No Known Restrictions Trading Floor, New York Stock Exchange (Highsmit by Carol M. Highsmith, public domain.
Underpricing
The best-known pattern in IPO research is that shares tend to close their first day of trading well above the price at which they were sold. Researchers call the gap "underpricing" and its value "money left on the table": in Ritter's definition, the closing market price on the first day of trading minus the offer price, multiplied by the shares offered.[5]
For 9,345 American IPOs from 1980 to 2025 (excluding very low-priced shares, special purpose acquisition companies, closed-end funds, real estate investment trusts and some other categories), Ritter's tables give a mean first-day return of 19.0 percent and a median of 7.0 percent.[5] Across those years the companies raised about $1.2 trillion and left about $250.1 billion on the table.[5] The averages swing widely: the mean first-day return was 71.2 percent in 1999 and 56.3 percent in 2000, at the height of the internet boom, against 11.9 percent in 2023 and 29.3 percent in 2025 (Ritter, Table 1).[5]
Why issuers accept this has been debated for decades, and no single explanation is accepted. Ritter and Welch's review sets out the main ideas:
- The winner's curse. If some investors are better informed than others, the uninformed ones receive full allocations mainly of the offerings that informed investors avoid. Underpricing is then needed so that, on average, uninformed investors break even. This model is associated with Rock (1986).[6]
- Information cascades. Investors watch whether others are buying; pricing slightly too high risks a complete failure in which everyone abstains because others abstain.
- Bookbuilding as information gathering. Investors who reveal that they would pay a high price must be rewarded for doing so with allocations and a lower price. In support, Ritter and Welch report that in 1980–2001 IPOs priced above their original range had average underpricing of 53 percent instead of three percent for those whose price was cut and 12 percent for those priced within the range.[6]
- Conflicts of interest. Underwriters with discretion over allocations may leave more money on the table than necessary and give the shares to favoured clients. Ritter and Welch cite evidence of allocations traded for favours, and of a practice known as "spinning", in which shares in hot offerings were given to executives of companies that might hire the bank.
Long-run performance
Studies have also examined how IPO shares do in the years after the first day. In Ritter and Welch's sample of IPOs from 1980 to 2001, the average IPO over three years underperformed the CRSP value-weighted market index by 23.4 percent, but trailed established companies of similar size and book-to-market ratio by only 5.1 percent.[6] The authors concluded that much of the weak performance reflects the kind of firm that goes public, mostly small growth companies, a category that had done poorly in general, and that long-run returns are sufficiently noisy to make any statistical inference difficult.
Who goes public
The typical company going public in the United States is about a decade old. Ritter's figures give a median age (years since founding) of 9 for 1980–2025 and 12 for IPOs in 2025, and show that 41 percent of IPOs in 1980–2025 were backed by venture capital.[5] The number of offerings is highly cyclical: 476 in 1999, 311 in 2021 (raising $119.4 billion) and 38 in 2022, by Ritter's count of operating companies (Table 1).[5]
IPOs around the world
Underpricing is not an American peculiarity. A table first published in 1994 by Tim Loughran, Jay Ritter and Kristian Rydqvist, and updated by Ritter on 30 March 2026, gives equally weighted average initial returns for 55 countries.[8] Its figures include 17.7 percent for 14,079 American IPOs from 1960 to 2025, 15.5 percent for 5,457 in the United Kingdom (1959–2025), 21.3 percent for 868 in Germany (1978–2025), 48.7 percent for 4,306 in Japan (1970–2025), 80.4 percent for 3,456 in India (1990–2024) and 159.3 percent for 5,410 in China (1990–2025). Only Bulgaria, with 46 IPOs from 2004 to 2023, shows a negative average, of −5.2 percent (Loughran, Ritter and Rydqvist, updated 2026).[8]
The figures are not strictly comparable.[8] The table's notes say that average initial returns are constructed in different manners from study to study: where market prices are available immediately, the one-day return is used, and where there is a delay before prices trade freely, a market-adjusted return over several weeks; for some markets with daily price limits, the notes describe using the first close at which the limit was not binding, or a one-week return. The authors' original article analysed the differences between countries in terms of binding regulations, contractual mechanisms and the characteristics of the firms going public, and presented evidence that companies successfully time their offerings for periods when valuations are high, with investors receiving low returns in the long run.
The decline in American IPOs
The number of American IPOs fell sharply after 2000 and has not recovered. In their 2013 article "Where Have All the IPOs Gone?" in the Journal of Financial and Quantitative Analysis, Xiaohui Gao, Jay Ritter and Zhongyan Zhu counted an average of 310 operating company IPOs a year in the United States from 1980 to 2000; Ritter's 2017 summary of the work puts the average for 2001–2016 at 108 a year, and says the drought had been especially severe among small firms. Ritter's later tables count 90 operating-company IPOs in 2025 (Table 1).[5] Firms with annual sales under $100 million (in 2024 dollars) made up 77 percent of IPOs in 1999 and 76 percent in 2000, but 32 percent in 2001 and 24 percent in 2002; across 1980–2025 the share was 56 percent, and in 2025 it was 39 percent (Table 12).[5]
Two explanations are debated. The conventional one, as the summary describes it, blames regulation, such as the Sarbanes-Oxley Act of 2002, and changes in stock trading: bid-ask spreads on Nasdaq stocks fell from 25 cents before 1994 to 1–2 cents, making market-making in small stocks unprofitable, and fewer firms provided the analyst coverage that small companies relied on (Gao, Ritter and Zhu, summary). The authors' alternative is that many small companies, especially technology start-ups, sell themselves to larger firms instead of going public because they are worth more as part of a bigger organisation, so that the decline is "a big vs. small company issue, not a public vs private company issue". In support they note that about 20 percent of exits by successful venture-backed companies in 1990–1991 were sales to other firms and 80 percent were IPOs, against about 60 percent sales in 1998–2000 and approximately 90 percent in 2001–2016, and that small public companies have increasingly reported losses (Gao, Ritter and Zhu, summary).
Alternatives to a traditional IPO
Auctions
Some companies have sold their shares by auction instead of letting underwriters set the price and choose the buyers. The best-known American case is Google's IPO in 2004; Ritter's tables note that it climbed 18.04% on its first day of trading.[5] Auctions have remained rare in the United States: Ritter counts 22 auction IPOs from 1999 to 2025, with an average first-day return of 12.5 percent.[5] Ritter and Welch noted that worldwide, auctions had been losing market share relative to bookbuilding.[6]
Direct listings
In a direct listing, a company's existing shares begi
