Version 5
Nov 17, 2026. Compare with the current version · Version history
The Consumer Price Index (CPI) is a monthly measure, published in the United States by the Bureau of Labor Statistics, of the average change over time in the prices that urban consumers pay for a representative basket of goods and services, and is the most widely quoted gauge of inflation.
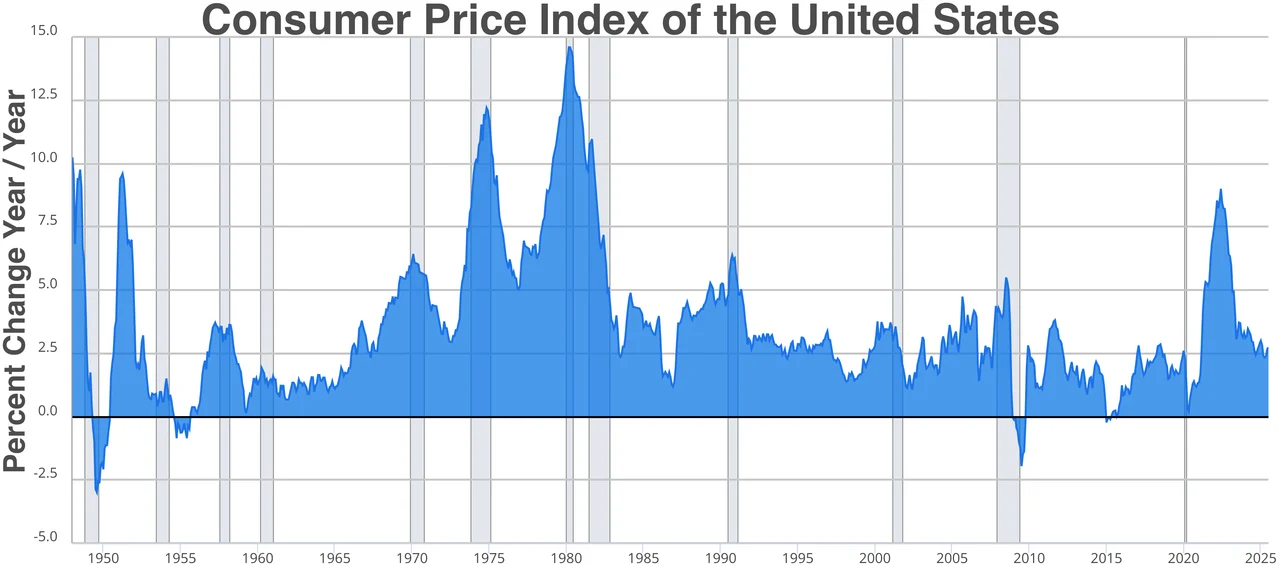
Via Wikimedia Commons: Consumer Price Index of the United States by FRED, public domain.
The Bureau of Labor Statistics (BLS), part of the U.S. Department of Labor, defines the CPI as a measure of the average change over time in the prices paid by consumers for a market basket of consumer goods and services.[1] Its monthly release is watched by markets, governments and wage negotiators, and it is written into law: the BLS notes that, through statutory action alone, the index affects the income of more than 108 million people, through Social Security payments, federal tax brackets and other programs. Many other countries publish an index of the same name and purpose; this entry describes chiefly the U.S. index, with a short section on others.
What it measures
The CPI is a price index, not a price. Most of its indexes are expressed against a reference base of 1982–84 = 100: the average level over those three years is set to 100, and later values show prices relative to it.[1] In October 2026 the main index stood at 337.511, meaning the basket cost about 3.4 times its average 1982–84 price.[4] What people usually call "the inflation rate" is the percentage change in this index, most often over twelve months, or over one month in the monthly news.
The BLS publishes indexes for two main populations:
- CPI-U (all urban consumers) covers households that make up over 90 percent of the U.S. population. It leaves out people living in rural areas outside metropolitan areas, farm households, people on military installations, members of religious communities and people living in institutions.[1] It is the index behind the headline monthly figure.
- CPI-W (urban wage earners and clerical workers) covers a subset of those households, approximately 30 percent of the total U.S. population: households in which at least half of income comes from wages in clerical, sales, service, labor and similar occupations, and at least one member has worked in such an occupation for 37 weeks or more in the past year.[1] It leaves out, among others, professional and salaried workers, the self-employed, the unemployed and retirees.
A third, the chained CPI (C-CPI-U), covers the same population as the CPI-U but is calculated differently, as described below.
The basket is broad. The BLS sorts all consumer spending into more than 200 categories, arranged into eight major groups: food and beverages; housing; apparel; transportation; medical care; recreation; education and communication; and other goods and services.[1] It also includes government-charged user fees such as water and sewerage charges, and sales and excise taxes paid on purchases.[1] It does not include income or Social Security taxes, or investment items such as stocks, bonds, real estate and life insurance, because these relate to saving and not to day-to-day consumption.
Housing and owners' equivalent rent
Housing is the hardest part of the basket to price, because a home is both a place to live and an asset. Since January 1983 the CPI-U has used a "rental equivalence" approach for homeowners (the CPI-W followed in January 1985): rather than tracking house prices, it estimates what owners would pay to rent their own homes, a measure called owners' equivalent rent.[2] Costs such as property taxes enter only indirectly, to the extent that they affect rental values.[1]
A conditional cost-of-living index
The CPI is often called a cost-of-living index, but the BLS says it differs in important ways from a complete cost-of-living measure. A true cost-of-living index would capture everything that affects people's living standards, including such things as safety, health and the environment; the CPI measures only the prices of goods and services bought in the market, so the BLS describes it as a conditional cost-of-living index.[1]
How it is compiled
Collecting prices
Every month BLS staff record the prices of about 80,000 items, visiting, calling or going online to thousands of retail and service establishments across the country, in three pricing periods each month.[1] As of 2023, about 16 percent of the sample's price quotes (excluding rent) came from online outlets.[1]
When an item changes, the BLS tries to keep the change in quality from showing up as a change in price. Its commodity specialists make adjustments that can range from accounting for a change in the size or quantity of a packaged item to more complex adjustments based on statistical analysis of the value of a product's features. A smaller package sold at the same price is therefore recorded as a price increase.
Weights
The items do not count equally. Each is weighted by how much consumers spend on it, using the government's Consumer Expenditure Surveys, in which households keep weekly diaries and answer quarterly interviews about their spending. The BLS now updates the weights every year, with the release of the January index, using the most recent expenditure data; as of 2023, the CPI-U and CPI-W weights were based on spending in 2021.[3]
Building the index
The calculation works in two stages. The urban United States is divided into 32 geographic index areas, and consumer spending into 243 basic items, giving 7,776 item-area combinations, each with its own basic index.[3] Within most of these cells the BLS has used, since 1999, a geometric mean formula, which allows for shoppers switching between similar items when relative prices change (buying a cheaper variety of apple, for example). A few, including some shelter, utilities and medical services, use a modified Laspeyres formula.[3] At the upper level, the CPI-U and CPI-W combine the basic indexes with a modified Laspeyres formula that holds the quantity weights fixed for a year.[3] In plain terms, the headline index asks how much the same basket of spending, fixed for a year, costs now compared with before.
The chained CPI, introduced in August 2002, instead uses a superlative formula, the Törnqvist formula, which lets the weights change as consumers move spending between categories. Because the information it needs arrives late, the chained index is first published as a preliminary estimate and becomes final 10 to 12 months after the reference month.[1]
Many CPI series are also seasonally adjusted to remove the effect of regular seasonal patterns, so that the month-to-month change shows the underlying movement; the October 2026 release, for example, reported that gasoline prices rose 1.0 percent after seasonal adjustment but fell 0.7 percent before it.[1][4]
How rent and owners' equivalent rent are measured
Shelter is the largest part of the index, so the way it is priced matters. According to the BLS, the CPI does not price homes that people own: owned housing units are not priced in the CPI Housing Survey, and mortgage interest, property taxes and the cost of improvements are treated as capital costs rather than consumption. For renters the measure is rent itself. For owners it is owners' equivalent rent (OER), the implicit rent of the home they live in.
Both indexes draw on one sample of rented homes. BLS data collectors visit a small number, usually five, of renter-occupied housing units in each sampled census segment, and rents are collected every six months, with six panels staggered across the year. Each month's index change comes from the panel visited that month: the average rent is compared with the average six months earlier, and the sixth root of that ratio is the one-month change. Rents are adjusted for changes in the quality of the unit, and an age adjustment allows for the fact that each unit is six months older at every visit. The rent index uses economic rent, which is contract rent adjusted for changes in services and utilities the landlord provides; the OER index uses pure rent, which excludes the cost of any utilities included in the contract rent. The BLS Handbook of Methods adds that each month's rent index is the previous month's index multiplied by the sixth root of the six-month rent change.[3]
Owners enter in a different way. In the Consumer Expenditure Survey, owners of primary residences are asked what they think their home would rent for each month, unfurnished and without utilities; the BLS says the answers set the OER weight only and are not used to measure price change. In the BLS table for December 2025, rent of primary residence had a relative importance of 7.840 percent and owners' equivalent rent of residences 26.204 percent, out of a shelter total of 35.625 percent.
Uses
The BLS lists three main uses: the CPI is an economic indicator, a deflator for other economic series (to turn amounts in dollars of different years into constant dollars), and a basis for adjusting dollar values.
- Social Security. Benefits are adjusted each year for inflation using the CPI-W. The adjustment is the percentage change in the average CPI-W for July to September over the same quarter a year earlier; on that basis the Social Security Administration announced on 14 October 2026 a cost-of-living adjustment of 3.6 percent for 2027, after 2.8 percent the year before.
- Taxes. Many amounts in the federal income tax, including the bracket thresholds, are indexed for inflation. Parts of the tax code were first indexed in the early 1980s, and in 2017 the Tax Cuts and Jobs Act switched the indexing to the chained CPI, which typically, but not always, shows less inflation. The tax code now defines the yearly figure as the average of the C-CPI-U for the 12-month period ending on August 31.
- Inflation-protected bonds. The Treasury adjusts the principal of Treasury Inflation-Protected Securities (TIPS), which it sells for terms of 5, 10 or 30 years, using a version of the CPI: the principal goes up with inflation and down with deflation, interest is paid on the adjusted principal, and a holder never gets back less than the original principal (see Bond).
- Wages and contracts. The CPI-U and CPI-W are commonly used in escalation agreements, including wage adjustments in many collective bargaining agreements.[1]
The CPI and the Federal Reserve
Although the CPI is the best-known inflation measure, the Federal Reserve does not target it. The Federal Open Market Committee aims for inflation of 2 percent over the longer run, as measured by the annual change in the price index for personal consumption expenditures (PCE), which is compiled by a different agency, the Bureau of Economic Analysis (BEA), with spending weights drawn from business surveys rather than the household survey the CPI uses. The two indexes usually differ. A BEA study by Clinton McCully, Brian Moyer and Kenneth Stewart found that from the first quarter of 2002 to the second quarter of 2007 the CPI-U rose 0.4 percentage point per year faster than the PCE price index.[8] Almost half of that gap came from the different index formulas; differences in weights, chiefly the larger weight the CPI gives to rent of shelter, more than accounted for the rest; and differences in which items each index covers partly offset the weight effect.[8]
Headline and core inflation
The BLS publishes the all-items index and also an index of all items less food and energy, usually called core.[1] The BLS says some users of CPI data prefer it because food and energy prices are relatively volatile, and they want to focus on the "core" or "underlying" rate of inflation. The exclusion is a choice made by users of the data; the headline index still includes both. In the BLS table of relative importance for December 2025, based on 2024 spending weights, food made up 13.698 percent of the CPI-U and energy 6.383 percent, leaving 79.919 percent for everything else; for the CPI-W the shares were 14.889, 8.052 and 77.058 percent. Shelter alone carried 35.625 percent of the CPI-U. In the October 2026 release, the headline index rose 0.4 percent in the month and core 0.3 percent.[4]
Research indexes for population groups
The official CPI-U and CPI-W do not produce inflation estimates for subgroups such as people aged 62 and older. The BLS does publish research indexes for some groups, including R-CPI-E for Americans 62 and older and R-CPI-I and R-C-CPI-I for income quintiles, but it warns that, because of their significant limitations, they should be interpreted with caution.[1] It also explains that the chained CPI is not final when first issued: it is revised three times a quarter-year apart and final 10 to 12 months after initial publication.[1]
History
The index grew out of the First World War. Rapid price rises during the war, especially in shipbuilding centers, created a need for a fuller index for setting cost-of-living adjustments in wages.[2] Family spending studies were carried out in 92 industrial centers in 1917–19 to set the weights; in 1919 the BLS began publishing separate indexes for 32 cities, and in 1921 it began regular publication of a national index, the U.S. city average.[2] According to a 2014 history in the BLS Monthly Labor Review by Stephen B. Reed, the early index was known as the Cost of Living Index, and when it was created in 1921 a series was built back to 1913, the first year of official CPI data.[5]
The method has been revised repeatedly. Comprehensive revisions in 1940, 1953 and 1964 brought in new expenditure weights and widened the sample of cities, adding medium and small cities in 1953 and the suburbs of metropolitan areas in 1964.[2] The fourth, in 1978, introduced the CPI-U and renamed the older index the CPI-W.[2] Rental equivalence for homeowners followed in 1983, the geometric mean formula in 1999 and the chained CPI in 2002.[2]
A century of price change
Reed's history traces the main episodes of U.S. inflation and deflation in the index:
- First World War: prices rose at an annualized rate of about 18.5 percent from December 1916 to June 1920, more than 80 percent in all; the twelve-month increase peaked at 23.7 percent in June 1920. They then fell by more than 20 percent from June 1920 to September 1922.[5]
- Great Depression: the CPI fell 27.4 percent between October 1929 and its low in April 1933.[5]
- Second World War and after: the twelve-month increase reached 13.0 percent in March 1942, before price controls took hold; after most controls were lifted, prices rose 20.1 percent from March 1946 to March 1947.
- The Great Inflation: from 1968 to 1983 the CPI rose 186.4 percent, about 7.3 percent a year, with the largest twelve-month increase, 14.8 percent, from March 1979 to March 1980, driven in large part by energy shocks.[5]
The same history notes that the twelve-month change in the CPI stayed positive from 1955 until March 2009. In 2022, according to the Tax Policy Center, inflation rose higher than at any time since 1981.
The 2022 peak
The largest rise of the 21st century so far came after the pandemic. The BLS reported that the CPI-U rose 9.1 percent over the twelve months ending June 2022, not seasonally adjusted, the largest twelve-month increase since the period ending November 1981, when it was 9.6 percent. Energy was up 41.6 percent over the year, the largest since April 1980, with gasoline up 59.9 percent; food rose 10.4 percent, the most since February 1981, and shelter 5.6 percent.
Criticism and the Boskin Commission
Because so much money is tied to the CPI, its accuracy is a political as well as a technical question. The best-known review was made by the Advisory Commission to Study the Consumer Price Index, appointed by the Senate Finance Committee and known after its chairman, the economist Michael J. Boskin, as the Boskin Commission. Its five members were Boskin, Ellen R. Dulberger, Robert J. Gordon, Zvi Griliches and Dale Jorgenson.[6] In its final report of 4 December 1996 it estimated that the CPI overstates changes in the cost of living by 1.1 percentage points annually, within a plausible range of 0.8 to 1.6 points.[6] The report included a Congressional Budget Office estimate that such a bias would add $1.07 trillion to the national debt by 2008, since tax brackets and many federal benefits are adjusted automatically by the CPI.[6]
The commission divided its estimate into four sources, as summarized by the U.S. General Accounting Office (GAO) in 2000:
- Upper-level substitution (0.15 point): consumers switching between categories, such as renting
