Version 5 (current)
Nov 13, 2026. Version history
Gross domestic product (GDP) is the monetary value of all final goods and services produced within a country's borders over a given period, such as a quarter or a year.[1] It is the most widely used single measure of the size and growth of an economy.[9]
The International Monetary Fund's introductory definition is that GDP measures the monetary value of final goods and services produced in a country in a given period of time (Tim Callen, Finance & Development, 2019).[1] "Final" means goods and services bought by their end users, so that something used up in making something else is not counted twice.[4] The U.S. Bureau of Economic Analysis (BEA), which compiles the American figures, puts it in one line: the value of the final goods and services produced in the United States is the gross domestic product.[2] BEA describes GDP as the signature piece of its National Income and Product Accounts (NIPAs), and notes that the White House and Congress use the figures to plan spending and tax policy and the Federal Reserve uses them in setting monetary policy.[2]
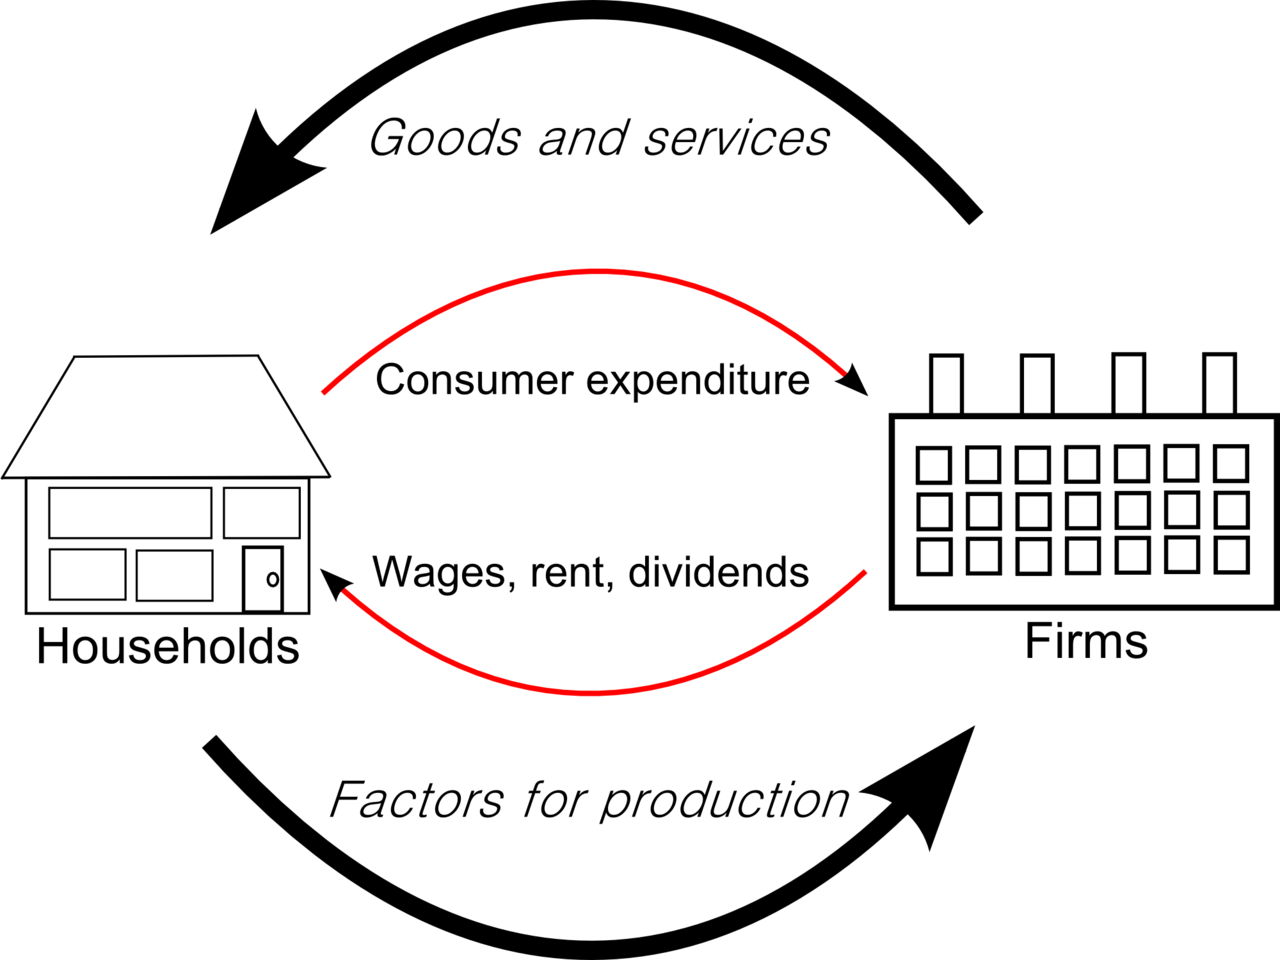
Via Wikimedia Commons: Circular flow of goods income by Irconomics, CC BY-SA 3.0.
What counts as production
Deciding what GDP includes means drawing a "production boundary" around the activities that count as economic production.[3] The international standard, the United Nations System of National Accounts (SNA), defines production as an activity carried out under the control and responsibility of an institutional unit that uses inputs of labour, capital, and goods and services to produce outputs of goods or services (as quoted in BEA's NIPA Handbook, chapter 2, updated December 2024).[3] Under that rule, the growth of trees in an uncultivated forest is not production, but harvesting the trees is.[3]
Some activities are left out on purpose.[3] In both the SNA and the U.S. accounts, household work such as housework, do-it-yourself projects, and care of family members is excluded, partly because these activities tend to be self-contained and partly because including them would make the accounts less useful for long-standing purposes such as tracking the business cycle.[3] Illegal activities should in principle be counted, but in the U.S. accounts they are left out in practice because they are conducted out of sight and data are not available to measure them.[3]
Other things with no market price are put in by estimate, a step called imputation.[3] The largest such imputation in the U.S. accounts is the value of the services provided by owner-occupied housing: a homeowner is treated as renting the house to themselves, so that GDP does not change according to whether a house is owned or rented.[3] Services that governments provide free or below cost are also inside the boundary; the IMF lists defense or education services provided by the government as examples of nonmarket production that GDP includes.[1] Because such services are not sold, Richard Stone, one of the architects of national accounting, explained that they can only be valued at cost, so that no profit or loss can appear for them.[11]
GDP is "gross" because it makes no deduction for the wearing out of buildings and equipment; as the IMF puts it, "gross" does not subtract depreciation, and subtracting depreciation gives net domestic product.[1] It is "domestic" because it counts production inside the country's borders, whoever does it.[5]
Three ways to measure it
GDP can be reached by three routes that should, in principle, give the same answer.[1][3]
- The production approach adds up value added at each stage of production, where value added is a producer's total sales minus the cost of the intermediate goods and services it bought in.[1] Counting only the value added at each stage is what keeps intermediate goods from being counted twice.[3]
- The expenditure approach adds up purchases by final users: households, businesses investing, governments and buyers abroad.[1]
- The income approach adds up the incomes generated by production, chiefly the pay of employees and the operating surplus of companies.[1]
Production and value added
BEA illustrates the double-counting problem with a car: the tires on a new car are counted once in the output of the tire plant and again in the value of the finished car, so adding up every producer's sales (gross output) would count them twice, and the rubber and metal sent to the tire plant would be counted three times.[3] The gap between the two totals is large: in the 2017 benchmark year, U.S. gross output was $34.5 trillion, while GDP was $19.6 trillion.[3] In the European framework, the sum of producers' value added (gross value added) is not quite GDP: Eurostat defines GDP as gross value added of all resident producers plus any taxes on products and minus any subsidies on products.[22]
The expenditure identity
The expenditure approach gives the formula most often quoted. In the U.S. accounts, GDP equals [personal consumption expenditures plus gross private domestic fixed investment plus change in private inventories plus government consumption expenditures and gross investment plus exports minus imports](bea.gov/resources/methodologies/nipa-handbook/pdf/chapter-02.pdf), often abbreviated as C + I + G + (X − M).[3] Imports are subtracted not because buying from abroad shrinks an economy, but because imported goods already sit inside the other totals: BEA's example is that consumer spending includes expenditures on imported cars as well as on domestically produced cars, so the imported cars have to be taken out again to leave only domestic production.[3]
In this framework "investment" means additions to the stock of fixed assets and to inventories.[3] BEA's private fixed investment covers business spending on nonresidential structures, equipment, and intellectual property products and residential investment, chiefly the construction of new homes; the government component includes both day-to-day spending to provide public services and government investment in structures, equipment and intellectual property.[3]
In data posted by BEA on 4 November 2026, U.S. GDP in 2025 was about $30.86 trillion in current dollars.[18] Personal consumption expenditures were about $20.87 trillion, or 67.6 percent of GDP; gross private domestic investment about $5.56 trillion (18.0 percent); and government consumption expenditures and gross investment about $5.36 trillion (17.4 percent).[18] Exports of $3.34 trillion (10.8 percent) were outweighed by imports of $4.26 trillion (13.8 percent), so net exports subtracted about $0.92 trillion, or 3.0 percent of GDP.[18]
The income side
On the income side, BEA sums compensation of employees (wages, salaries and employer contributions for pensions, insurance and social insurance), taxes on production and imports less subsidies, net operating surplus (a profits-like measure of what enterprises earn from production) and consumption of fixed capital, BEA's measure of depreciation.[3] Taxes on income are not part of this total, and subsidies are subtracted because they are, in effect, a negative tax paid by government to business.[3] In the 2025 figures, compensation of employees was about $15.72 trillion, roughly 51 percent of gross domestic income; net operating surplus about $8.02 trillion (26 percent); consumption of fixed capital about $5.06 trillion (16 percent); and taxes on production and imports about $2.23 trillion, less about $0.12 trillion of subsidies.[18]
The total measured from incomes is called gross domestic income (GDI).[3] In theory, GDI equals GDP; in practice the two are built from different source data and never match exactly, and the gap between them is called the "statistical discrepancy".[3] BEA considers its expenditure data generally more reliable than its income data, and also publishes the equally-weighted average of GDP and GDI because reliability studies found the average tracks growth better.[3] By convention the discrepancy is recorded on the income side and defined as GDP less GDI, and even after comprehensive revisions the two measures continue to differ slightly.[21] For 2025, GDI of about $30.91 trillion exceeded GDP, leaving a statistical discrepancy of about −$46 billion.[18]
Nominal and real GDP
GDP measured at the prices of the time is nominal GDP: in the IMF's words, nominal GDP is collected at current prices.[1] Because a rise in nominal GDP can come from higher prices rather than more output, comparisons over time use real GDP, which is adjusted for inflation with a price index called a deflator.[1] BEA calls its inflation-adjusted figures real or "chained" GDP, after the chain-type indexes it computes using a Fisher formula.[2][3] The difference can be large: in the third quarter of 2026, BEA's advance estimate showed current-dollar GDP growing at an annual rate of 5.6 percent and real GDP at 3.4 percent.[20]
A chain-type index works year by year.[19] BEA measures, for example, the change in real GDP from 2014 to 2015 using prices for 2014 and 2015 as weights, and then multiplies ("chains") these annual changes together to form a time series; the Fisher formula takes the geometric mean of an index weighted by the earlier period's prices (a Laspeyres index) and one weighted by the later period's (a Paasche index).[19] BEA introduced chain-weighted indexes as its featured measure in 1996; before then, real GDP was measured with fixed weights from a single base year.[19] BEA lists among the advantages that chained measures eliminate the substitution bias of fixed weights, which tends to understate growth before the base year and overstate it afterwards, and that they end the old practice of updating the base year about every five years and so rewriting economic history.[19] The cost is that "chained-dollar" levels of the components are not additive: they do not sum to real GDP and do not give accurate shares or contributions to growth.[19]
Several price measures come out of the accounts.[3] The GDP price index measures the prices of goods and services produced in the United States, whereas BEA's featured inflation measure, the price index for gross domestic purchases, measures prices paid by U.S. residents wherever the goods were made, so a rise in the price of an imported car affects the second but not the first.[3] BEA also publishes the personal consumption expenditures (PCE) price index, which is frequently compared with the consumer price index produced by the Bureau of Labor Statistics.[3]
Comparing countries
To compare economies of different sizes, GDP is often divided by population to give GDP per capita; the United Nations Human Development Index, for instance, ranks countries using GDP per capita plus life expectancy, literacy, school enrollment.[1] Converting each country's GDP into a common currency raises a further choice.[1] Market exchange rates can be used, or purchasing power parity (PPP) rates, which are the rates needed to buy the same basket of goods and services in each country.[1] PPP conversion typically gives emerging and developing economies a higher dollar GDP than market exchange rates do.[1] The World Bank explains why: price levels tend to be higher in high-income countries, so comparisons at exchange rates overstate the economic size of high-income countries while understating the economic size of low-income countries.[34]
At market exchange rates, World Bank data last updated in November 2026 put world GDP in 2024 at about $111.7 trillion in current U.S. dollars.[16] On the same basis the United States produced about $29.3 trillion, roughly 26 percent of the world total, and China about $18.7 trillion, roughly 17 percent; India's GDP was about $3.8 trillion.[16] The World Bank publishes these series as GDP (current US$) in its World Development Indicators.[16]
PPPs come from the International Comparison Program (ICP), which the World Bank coordinates under the auspices of the UN Statistical Commission; its 2021 round, released on 30 May 2024, was the tenth comparison since the program began in 1968 and covered 176 economies.[34] Measured at PPPs, the world economy in 2021 was $152.4 trillion.[35] On that basis China was the largest economy, at $28.8 trillion or 18.9 percent of the world total, followed by the United States at nearly $23.6 trillion (15.5 percent) and India at $11.0 trillion (7.2 percent).[35] The same round put world GDP per capita at $20,271, with Luxembourg highest at $137,948, the United States tenth at $70,988 and China at $20,407, just above the world mean.[35]
GDP and GNP
Gross national product (GNP) is a close relative that draws its boundary around people rather than territory.[5] In BEA's definitions, GDP measures the goods and services produced within the country's geographical borders, whether by residents or by residents of other countries, while GNP measures the goods and services produced by only U.S. residents, both domestically and abroad.[5] So the output of a foreign-owned factory in the United States is part of U.S. GDP, while what U.S. residents produce abroad is part of U.S. GNP but not of U.S. GDP.[5] In accounting terms, one moves from a "domestic" to a "national" measure by subtracting net income payments to the rest of the world, or equivalently adding net income receipts from abroad.[3] For the United States the two are close: in 2025, GNP was about $30.85 trillion, against GDP of about $30.86 trillion.[18]
Gross national income (GNI) measures the incomes earned in the production of GNP.[3] In the European Union, Eurostat notes that GDP, GNI and the government deficit, compiled under the European System of Accounts, are used to define EU members' contributions to the EU budget and the allocation of structural funds.[10]
History
The idea of adding up a nation's income is much older than GDP.[11] In his 1984 Nobel lecture, the economist Richard Stone traced the origins of national economic accounting to seventeenth-century England.[11] In 1664 William Petty, a physician, land surveyor and co-founder of the Royal Society, wrote a paper called Verbum Sapienti, largely with the object of making the tax system more equitable, in which he gave what Stone called the first known estimates of what may be called balances of the national economy.[11] Petty put the population of England and Wales at 6 million and their yearly expense on food, housing, clothes and other necessaries at £40 million.[11] He estimated the income from land at £8 million and from other property at £7 million, and attributed the remaining £25 million to the labour of the people, a figure Stone noted was obtained as a residual in order to balance the account rather than estimated independently.[11]

Via Wikimedia Commons: Sir William Petty, RP-P-OB-32.820 by Rijksmuseum, CC0.
Gr
