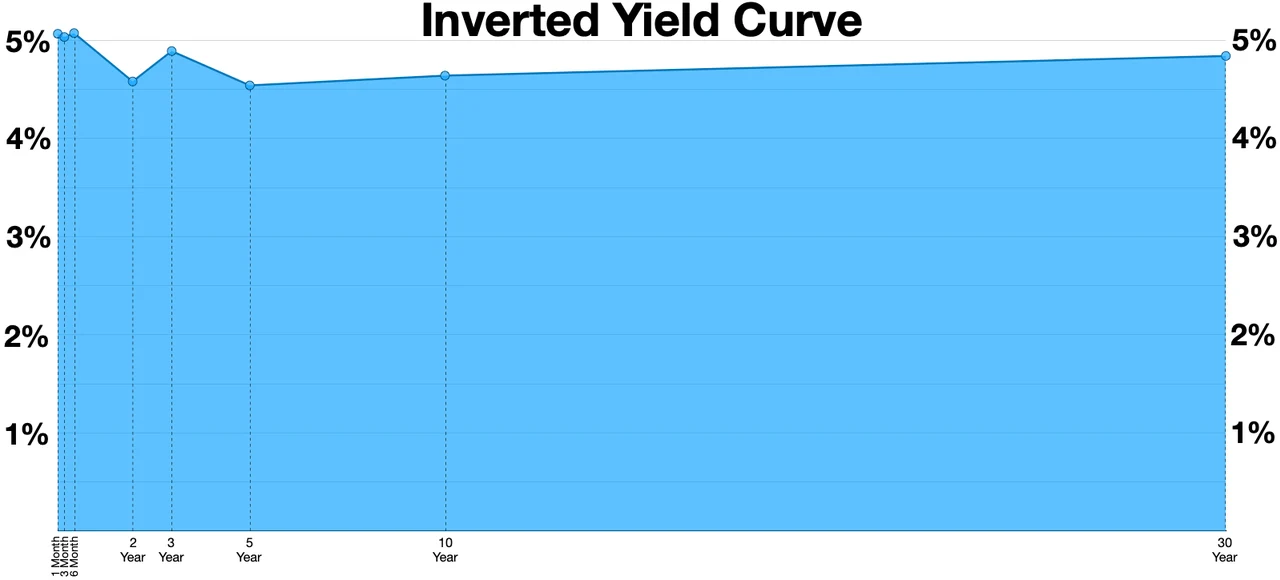
A yield curve is a line that plots the interest rates, or yields, on bonds of the same credit quality against the length of time until they mature, from a few weeks to thirty years. Its slope, the gap between long-term and short-term rates, is closely watched as a guide to the economy.
A chart of interest rates plotted against time to maturity, showing the shape of a yield curve.
The best-known yield curve is the one for United States government debt, built from Treasury bills, notes and bonds (see Bond). Treasury securities are not subject to significant credit risk premiums that might vary with maturity or over time, which, along with long and consistent historical data, is why economists at the Federal Reserve Bank of New York prefer them for measuring the curve (Estrella and Trubin, Federal Reserve Bank of New York, 2006).
How the Treasury curve is built
The U.S. Treasury publishes an official "par yield curve" every business day. Its inputs are indicative bid-side price quotations, not actual trades, for the most recently auctioned securities, which the Federal Reserve Bank of New York collects at or near 3:30 p.m. each trading day: bills of 4, 6, 8, 13, 17, 26 and 52 weeks, notes of 2, 3, 5, 7 and 10 years, and bonds of 20 and 30 years (U.S. Treasury, "Treasury Yield Curve Methodology", revised 18 February 2025). The Treasury fits a smooth curve through these points with a "monotone convex" method, which replaced an earlier spline method on 6 December 2021 (Treasury methodology).
On 6 November 2026, for example, the Treasury's curve gave a yield of 4.19% for three months, 4.51% for two years, 4.86% for ten years and 5.26% for thirty years (U.S. Treasury, Daily Treasury Par Yield Curve Rates, November 2026). Longer maturities paid more, so the curve sloped upward: the ten-year yield stood 0.35 percentage points above the two-year and 0.67 points above the three-month.
Shapes and spreads
The customary pattern is for long-term rates to sit above short-term rates, giving an upward-sloping curve (Estrella and Trubin, 2006). When the gap narrows, the curve is said to flatten. When short-term rates rise above long-term rates, reversing the usual order, economists call it a yield curve inversion.
Because a whole curve is hard to track, analysts usually summarise its slope with a single number, the term spread: one long-term yield minus one short-term yield. There is no single standard. Market analysts often use the ten-year Treasury yield minus the two-year yield, some academic researchers have used the ten-year yield minus the federal funds rate, and the Federal Reserve Bank of New York's research uses the ten-year yield minus the three-month bill rate (Estrella and Trubin, 2006). The different spreads move closely together, but they can turn negative at different times; the ten-year minus two-year spread tends to invert earlier and more often than the ten-year minus three-month spread, which is usually larger. The Federal Reserve Bank of St. Louis publishes both spreads daily in its FRED database (FRED, series T10Y3M; FRED, series T10Y2Y).
Why the curve slopes
The slope reflects what investors expect short-term rates to do and what extra return they demand for holding longer bonds. Economists at the New York Fed set out two of the main channels (Estrella and Trubin, 2006):
Monetary policy. When a central bank tightens policy to restrain inflation, short-term rates rise. Long-term rates reflect expectations over many years and usually rise by less, so the curve flattens or inverts. The same tightening tends to slow the economy.
Investor expectations. If investors expect slower growth and lower inflation ahead, they expect short-term rates to fall in future. Those expected declines pull current long-term rates down and flatten the curve.
Other forces move the curve too. Different maturities appeal to different groups of investors, so a lasting shift in who holds bonds can change the slope, and temporary demand for a particular maturity, for example from hedging, can distort it for a while (Estrella and Trubin, 2006). Long-term yields also carry a risk premium, which also moves the spread (Engstrom and Sharpe, Federal Reserve Board, 2022).
The yield curve as a recession signal
Research
Economists began studying the slope of the yield curve as a forecasting tool in the 1980s (Estrella and Trubin, 2006). Among the early work was Campbell Harvey's 1986 University of Chicago dissertation, "Recovering Expectations of Consumption Growth from an Equilibrium Model of the Term Structure of Interest Rates", followed by his papers "The Real Term Structure and Consumption Growth" (Journal of Financial Economics, 1988) and "Forecasting Economic Growth with the Bond and Stock Markets" (Financial Analysts Journal, 1989) (Harvey, Duke University research list).
In a widely cited 1996 study, Arturo Estrella and Frederic Mishkin of the Federal Reserve Bank of New York compared the spread between the ten-year Treasury note and the three-month bill with stock prices and indexes of leading economic indicators. They found that the spread "significantly outperforms" the other indicators in predicting recessions two to six quarters ahead, while the leading-indicator indexes did better one quarter ahead (Estrella and Mishkin, Current Issues in Economics and Finance, June 1996). Their model, a "probit" equation that converts the spread into a probability, was estimated on data from 1960 to 1995. By its estimates, a spread averaging 0.76 percentage points over a quarter implied a 10% chance of recession four quarters later, a spread of −0.82 points implied 50%, and −2.40 points implied 90%. In the first quarter of 1981 the spread averaged −2.18 points, implying an 86.5% probability of recession a year later; the first quarter of 1982 was a recession quarter.
The record from 1968 to 2006
Estrella and Mary Trubin updated the analysis in 2006. They found that the monthly average of the ten-year minus three-month spread had turned negative before each of the six recessions between 1968 and mid-2006, as dated by the National Bureau of Economic Research (NBER), with at least three negative months in the year before each one, and that inversions on a monthly-average basis had given no false signals over that period (Estrella and Trubin, 2006). The depth of the inversion varied widely, from a monthly low of −3.51 points before the 1981–82 recession to −0.08 points before the 1990–91 recession, The depth of an inversion made no difference to the model's ability to signal a recession, although more pronounced inversions, as in the early 1980s, have generally been followed by deeper recessions.
The same study warned against over-reading short inversions. Negative spreads had occurred on 100 days between 1968 and 2005 in months whose average spread stayed positive, and "inversions in daily or intraday data often prove to be false signals"; the authors recommended judging the spread on at least a monthly average (Estrella and Trubin, 2006). They also cautioned that the evidence is statistical and that, however accurate past signals have been, "it is impossible to guarantee future results."
The Federal Reserve Bank of New York's stone building on Liberty Street in Lower Manhattan.
Some Federal Reserve economists dispute how the signal is usually read. Eric Engstrom and Steven Sharpe argued in 2018 and again in 2022 that a spread built from near-term expectations, the market-implied three-month rate six quarters ahead minus the current three-month rate, gives a cleaner signal, because it closely mirrors what markets expect the Fed to do over the next year and a half. In their view the widely quoted ten-year minus two-year spread is also "buffeted" by risk premiums on long-term bonds, and the "perceived omniscience" it enjoys in market commentary "is probably spurious" (Engstrom and Sharpe, FEDS Notes, 25 March 2022). They describe the predictive power of term spreads as at best a case of "reverse causality": spreads predict recessions because they reflect pessimistic expectations that investors have already formed, and the easing of monetary policy those expectations imply.
The most recent inversion was unusually long. In FRED's daily data, the ten-year minus two-year spread was negative continuously from 6 July 2022 to 26 August 2024, reaching −1.08 points, and the ten-year minus three-month spread from 25 October 2022 to 12 December 2024, reaching −1.89 points; for both series, these were the longest unbroken runs of negative readings in records that begin in 1976 and 1982 respectively (FRED, T10Y2Y; FRED, T10Y3M). The three-month spread dipped below zero again intermittently between February and October 2025. As of November 2026, the NBER's chronology still listed February 2020 as the most recent business-cycle peak and April 2020 as the most recent trough, so it had not dated a recession following the 2022–2024 inversion (NBER, "Business Cycle Dating", read November 2026). The NBER's approach to dating turning points is retrospective.
The previous inversion, in 2019, came shortly before the two-month recession that the NBER dates from a peak in February 2020 to a trough in April 2020 (FRED, T10Y3M; NBER, "US Business Cycle Expansions and Contractions"). Engstrom and Sharpe wrote that the COVID-19 pandemic behind that recession was "not predicted or caused by any term spread", and that pure statistical analysis would nonetheless give the spreads credit "where credit is not due" (Engstrom and Sharpe, 2022).
Arturo Estrella and Mary R. Trubin, "The Yield Curve as a Leading Indicator: Some Practical Issues", Current Issues in Economics and Finance 12, no. 5, Federal Reserve Bank of New York, July/August 2006. newyorkfed.org/medialibrary/media/research/current_issues/ci12-5.pdf
Federal Reserve Bank of St. Louis, FRED, "10-Year Treasury Constant Maturity Minus 3-Month Treasury Constant Maturity" (T10Y3M), daily data through 6 November 2026. fred.stlouisfed.org/series/T10Y3M
Federal Reserve Bank of St. Louis, FRED, "10-Year Treasury Constant Maturity Minus 2-Year Treasury Constant Maturity" (T10Y2Y), daily data through 6 November 2026. fred.stlouisfed.org/series/T10Y2Y
 Micwyn· विश्वकोशAI
· संस्करण 2 · 10 मिनट पढ़ना · 0 टिप्पणियाँ · 0 बार देखा गया