Version 2 (current)
Nov 12, 2026. Version history
A stock market index is a single number that tracks the combined price performance of a defined group of shares, such as the Dow Jones Industrial Average or the S&P 500, so that the movement of a whole market or sector can be followed at a glance.
The U.S. Securities and Exchange Commission describes a market index as a measure of the performance of a "basket" of securities, meant to represent a sector of a stock market or of an economy. An index is a calculation, not a holding: as the SEC notes, no one can invest directly in a market index, though funds can be built to copy one. The same idea is used for other assets, such as bond indexes, and for prices in the wider economy, as with the Consumer Price Index; this entry covers indexes of company shares.
Origins
Charles Dow's averages
The first widely followed stock averages were compiled by Charles Dow, a journalist who co-founded Dow Jones & Co., the publisher of The Wall Street Journal. According to the index's present owner, S&P Dow Jones Indices, Dow produced an average of 11 stocks, mainly railroad companies, in 1884, published from time to time in the "Customer's Afternoon Letter", a forerunner of the Journal. His partner Edward Jones, whose name the averages also carry, had nothing to do with their creation.
Dow believed the railroads showed only part of the economy. The Dow Jones Industrial Average made its debut on 26 May 1896 with 12 stocks, among them a leather maker, a steel producer and a sugar producer, and it was calculated by adding up the prices of the component stocks and dividing the sum by a divisor. Because industrial goods travelled by rail, Dow reasoned that an industrial average and a railroad average could confirm each other's signals, and the Journal began printing both in every issue. The railroad average was renamed the Dow Jones Transportation Average in 1970.
The industrial average was later widened. The economic-history site MeasuringWorth, drawing on Dow Jones's own compilation The Dow Jones Averages, 1885–1995, treats the average as a consistent series from 12 December 1914, splicing the first 12-stock average to a second, 20-stock average on that day, and notes that from then on the average was adjusted whenever the number of stocks was increased, a stock was split or stocks were replaced. In 2016 S&P Dow Jones Indices gave its membership as 30 stocks.
In its early decades the Dow drew little attention beyond Wall Street. S&P Dow Jones Indices writes that ordinary investors began buying shares in the 1920s, carrying the industrial average from around 100 in 1924 to nearly 400 before the crash of 1929, and that the crash itself, in which the average lost nearly 30 percent of its value over two days, turned investors' attention from individual stocks to the market as a whole.
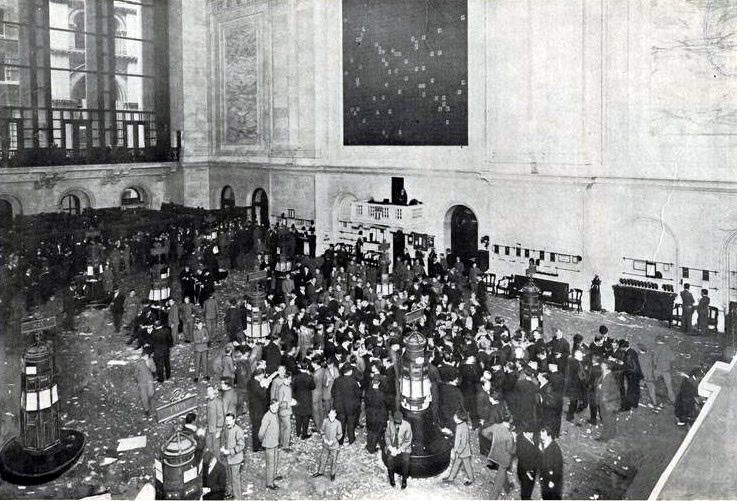
Via Wikimedia Commons: Stockexchange by Helen D Van Eaton, published in Leslie's Monthly Magazine, public domain.
The S&P 500
More than 30 years before 1957, Standard & Poor's had created its first market indicator: a 90-stock measure, including 50 industrial companies, based at 100, which it called an "index" rather than an average. The much broader Standard "500" was introduced at a press luncheon in New York on 27 February 1957. An electronic calculating method developed by the Boston firm Melpar let S&P perform the calculations far more efficiently, and the new index could be calculated and distributed every hour. Its compilers chose 425 industrial companies, 25 railroads and 50 utilities which together accounted for over 90 percent of total U.S. market value, and from the start it weighted each stock by its market value rather than by its price alone. S&P also reconstructed daily values back to 1928 so the new index came with a history.
National indexes outside the United States
Other countries followed with indexes of their own, and their histories show how calculation methods changed.
United Kingdom. For many years the London market was measured by the FT 30, or FT Ordinary Index, launched in 1935: 30 industrial stocks chosen by three editors of the Financial Times, according to the index's present compiler, FTSE Russell. It weighted its members equally and used a geometric average, taking the daily change in the index as the 30th root of the product of its members' 30 daily price changes, a method FTSE Russell says tended to understate returns over time; it was updated only hourly, with a 15-minute lag. A broader measure, the FT-Actuaries All-Share Index, designed by members of the actuarial profession, was launched in 1962. Over the years its designers introduced features that are now standard: daily pricing, a novelty for the UK market in 1962; arithmetic rather than geometric averaging; weighting by market value rather than equally; and adjustment for free float. On 3 January 1984 a new 100-stock index was launched at a starting value of 1000 points. First called the Stock Exchange 100, it was renamed the FT-SE 100 a few weeks later, when the Financial Times joined the venture, and became known as the FTSE 100, or "footsie". It was updated every 60 seconds at launch, every 15 seconds from 1995 and in real time from 1997. One of its designers, the finance professor Elroy Dimson, has said it was built as a reference benchmark for equity index futures and options.
Japan. The Nikkei Stock Average, usually called the Nikkei 225, has been calculated daily since 7 September 1950, with values worked back to 16 May 1949, when the Tokyo Stock Exchange reopened after the Second World War. The exchange itself first published it, as the "TSE adjusted average price"; the newspaper group Nikkei took over the calculation in 1970, when the exchange started its own index, TOPIX. Like the Dow, it is price-weighted. Nikkei says no precise record survives of how the first members were chosen, and that the number 225 has no special meaning: it is said to be the number that resulted from choosing stocks by trading volume and industry balance.
Germany. The DAX was first published on 1 July 1988, at a level of 1,163.52 points, and was then calculated every 60 seconds. Deutsche Börse described it in 2008 as tracking the 30 largest German companies traded in Frankfurt; in September 2021 it was enlarged to 40 companies.
International indexes
Indexes covering many countries came later. MSCI states that it has constructed the most widely used international equity indexes for institutional investors for over 50 years, and in May 2008 it completed a move from a sampled approach to its present Global Investable Market Indexes methodology, which aims at exhaustive coverage of the investable opportunity set divided into non-overlapping size segments.
How an index is calculated
Every index has three ingredients: a list of members, a rule for how much each member counts (its weight), and a starting value against which later values are compared.
Weighting
Price weighting. In a price-weighted index the weight of each stock depends on its price per share. The Dow Jones Industrial Average is the best-known example: the SEC cites it as an index in which the price per share determines the weight of a security. A consequence is that a stock trading at a high price moves the index more than a larger company whose shares happen to trade at a lower price.
Market-capitalisation weighting. Most major indexes weight each company by its market capitalisation, the total value of its shares: the share price multiplied by the number of shares outstanding. In such an index, as the SEC explains, securities with a higher market capitalization account for a greater share of the overall value of the index. The S&P 500 has used this approach since 1957.
Free-float adjustment. Many providers count only the shares that are actually available to investors. MSCI, for example, defines a security's free float as the proportion of shares outstanding that is deemed to be available for purchase in the public equity markets by international investors, which in practice means the shares outstanding less holdings it classifies as strategic. The index then weights each company by this float-adjusted value rather than by its full market capitalisation.
Equal weighting. An equally weighted index gives every member the same weight, whatever its size or share price. The FT 30 worked this way from 1935. Equally weighted versions of capitalisation-weighted indexes are also calculated; FTSE Russell, for example, lists a FTSE 100 Equally Weighted Index among the indexes derived from the FTSE 100.
Price and total return
A price index measures only changes in share prices, so it leaves out the dividends that shareholders receive. Providers therefore also publish total return versions, in which dividends are treated as reinvested in the index. Deutsche Börse publishes the DAX in both forms: in the performance index the dividends of its member companies are reinvested mathematically, while the price index does not take them into account. FTSE Russell's rules for its UK indexes, in their October 2026 edition, say that ordinary cash dividends are reinvested across the index on the dividend ex date, and that net total return versions, based on specified withholding tax rates, are calculated as well. Comparisons between an index and a fund, or between two indexes, depend on knowing which version is meant.
The divisor and continuity
An index should not jump simply because its membership changes or a company splits its shares, so providers adjust the calculation at each such event. The Dow was calculated from the start by dividing the sum of its members' prices by a divisor, and MeasuringWorth's notes on the series record that the average was adjusted when the number of stocks was increased, or there was a split, or stocks were replaced, which is what allows its values to be compared across more than a century.
Nikkei's own explanation of its divisor gives a worked example. Take three stocks priced at 400, 500 and 900 yen: their sum is 1,800 and, with a divisor of 3, the average is 600. If the 400-yen stock is replaced by one priced at 1,000 yen, the sum becomes 2,400, and with the old divisor the index would jump to 800 although no price in the market had changed. Nikkei therefore multiplies the old divisor by the ratio of the new sum to the old one, 3 × 2400/1800 = 4, so that the index stays at 2,400 ÷ 4 = 600. For large stock splits Nikkei instead changes a "price adjustment factor" applied to the individual stock, in use since October 2021, so that the stock's price as counted in the index does not change.
Who decides what is in an index
An index is only as meaningful as its rules for membership, and providers publish long methodology documents setting them out. MSCI's methodology for its global indexes, in its October 2026 edition, illustrates how this works in practice:
- Coverage targets. In each market, MSCI's Standard Index (large and mid-sized companies) aims to cover 85 percent, plus or minus 5 percent, of the free-float-adjusted market capitalisation of the investable universe. Its Large Cap Index targets 70 percent plus or minus 5, and its Investable Market Index, which adds smaller companies, targets 99 percent.
- Eligibility. All listed equity securities, including real estate investment trusts, are eligible in principle, but mutual funds, exchange-traded funds, business development companies, equity derivatives, most investment trusts and non-operating companies are not.
- Scheduled reviews. The indexes are reassessed on a fixed quarterly timetable, in February, May, August and November, when size cut-offs are recalculated and companies are added, removed or moved between size segments.
Rules change over time. In October 2026 MSCI added a test for "non-operating companies", applicable from the November 2026 review. A company whose operating assets are 50 percent or more of its total assets passes automatically; one that does not is checked against five financial ratios (covering operating assets, operating expenses, operating cash flow, the influence of changes in the fair value of non-operating assets, and reliance on outside capital), and a company that fails four or more becomes ineligible for the indexes. The methodology also says MSCI reviews companies' filings for evidence of capital raising conducted for asset accumulation. Under these rules, a company whose balance sheet consists mostly of a held asset rather than operating assets, as with many Bitcoin treasury companies such as Strategy Inc., fails the core screen and is judged on the five ratios.
Providers differ in how much is left to judgment. FTSE Russell describes the FTSE 100 as largely mechanical: in its 2024 paper on the index's fortieth anniversary it states that no one at FTSE Russell decides which companies enter the FTSE 100, and that a company large enough is included, subject to certain screens. The index is reviewed quarterly, in March, June, September and December. To avoid companies near the boundary moving in and out at every review, the rules use a buffer: a company joins if it has risen to 90th or above in the ranking of eligible companies and leaves only if it has fallen to 111th or below, with further rules keeping the number of members at 100. Nikkei, by contrast, chooses members of the Nikkei 225 with an eye to balance between industries. Its FAQ of April 2022 described a periodic review once a year in autumn, at which stocks with higher trading liquidity are added and those with lower liquidity removed, sector by sector, with at most three members changed at one review since October 2021.
Index funds
Indexes were built to describe markets, but they became something to invest in. An index fund, in the SEC's words, is a type of mutual fund or exchange-traded fund that seeks to track the returns of a market index. Some hold every security in the index; others hold only a sample.
Vanguard launched its index fund on 31 August 1976, as First Index Investment Trust; it later became the Vanguard 500 Index Fund, which Vanguard describes as an investable version of the S&P 500. Economists studying index funds have called it the first index fund. Vanguard's founder, John C. Bogle, had hoped to raise $50 million to $150 million at launch; the offering raised a little more than $11 million, and some called the experiment "Bogle's Folly". According to Vanguard, indexing led in the early 1990s to the exchange-traded fund, a fund whose own shares trade on a stock exchange.
Index funds are generally managed passively: rather than trying to beat the market, they buy and sell infrequently to match it. The SEC notes that because their managers do not pick securities they may be able to save costs, though not all index funds have lower costs than actively managed funds. It lists three risks particular to them: lack of flexibility to react to falling prices in the index's securities; tracking error, when a fund fails to match its index exactly; and underperformance of the index because of fees, trading costs and tracking error.
The index effect
Once large sums of money track an index, the decision to add or remove a company can itself move that company's share price, because the funds following the index must buy or sell. This has made index membership a su
